With a clever approach and some good spring cleaning tips, the community driven articles from Azure Spring Clean, will promote well managed Azure tenants!
Follow these Azure Spring Cleaning tips for a Sparkling Azure environment! It will guide you with best practices, lessons learned, and help with some of the more difficult topics of Azure Management!

Azure Spring Clean will provide you with 5 base topics, across 5 work days of the 4 weeks of February.
Special thanks to Joe Carlyle and Thomas Thornton for organizing this event!
Monitoring Azure Site Recovery
My contribution will be this blogpost about monitoring Azure Site Recovery.
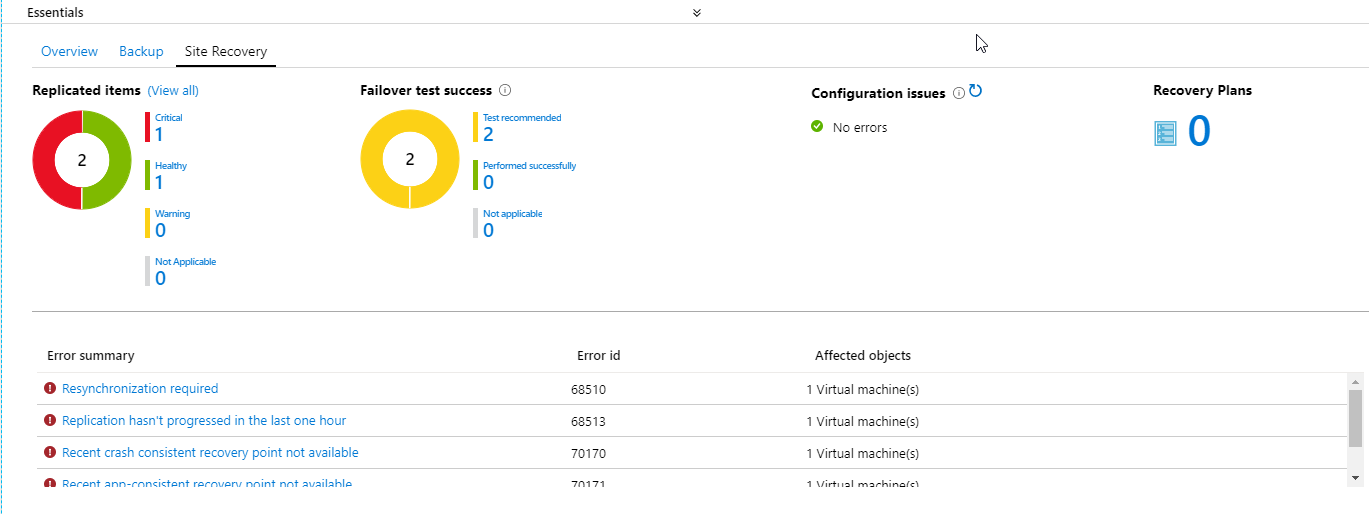
Azure Site Recovery has some good builtin monitoring and nice dashboards. You can view this in the Azure Portal, if you go to your Recovery Services Vault and click on Overview or select Site Recovery. The Site Recovery Services dashboard consolidates all monitoring information for the vault in a single location.
You can monitor:
- The health and status of machines replicated by Site Recovery
- Test failover status of machines.
- Issues and errors affecting configuration and replication.
- Get a list of the recovery plans.
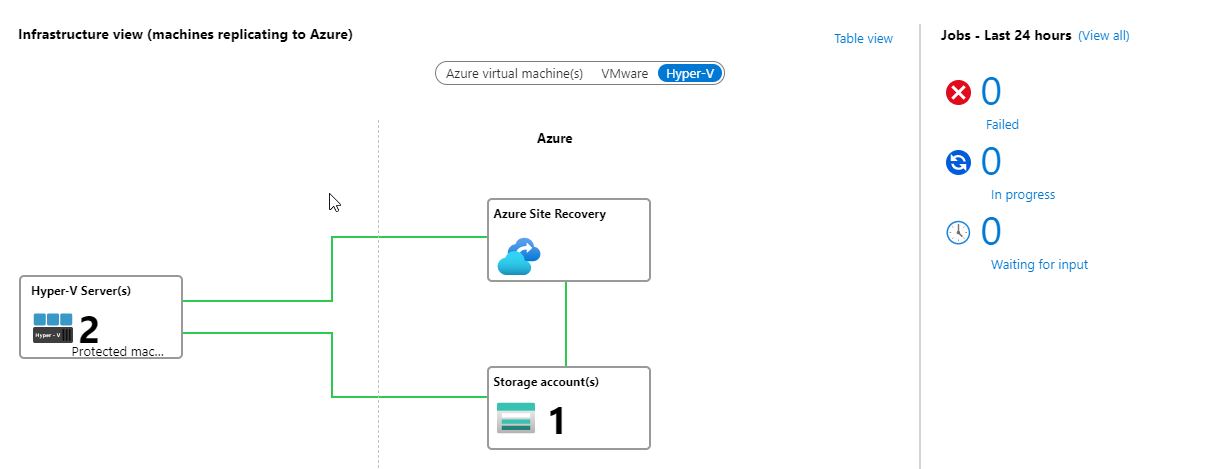
A second monitor view is the Infrastructure view, where you get information about the machines replicating to Azure. Here you can monitor and see issues with the infrastructure components that are replicated to Azure.
Use Log Analytics
Why should you use Azure Log Analytics to monitor Site Recovery? Because you want to get more insights into the replication status and know what is going on! These default error messages are not giving much information:
Error Message: The virtual machine couldn’t be replicated.
That’s when Azure Log Analytics comes to the rescue! You can collect logs and get more information about:
- Machine RPO
- Upload rate
- Data change rate (churn)
One of the common problems with ASR is when a VM has too much changed data, ASR can’t keep up with replicating those changes. That’s when you get the churn rate errors. When this happens, the replication goes into an error state and you can’t guarantee your defined RPO.
Before we can see some logs, we have to register the resource provider, create a Log Analytics workspace and enable diagnostics settings.
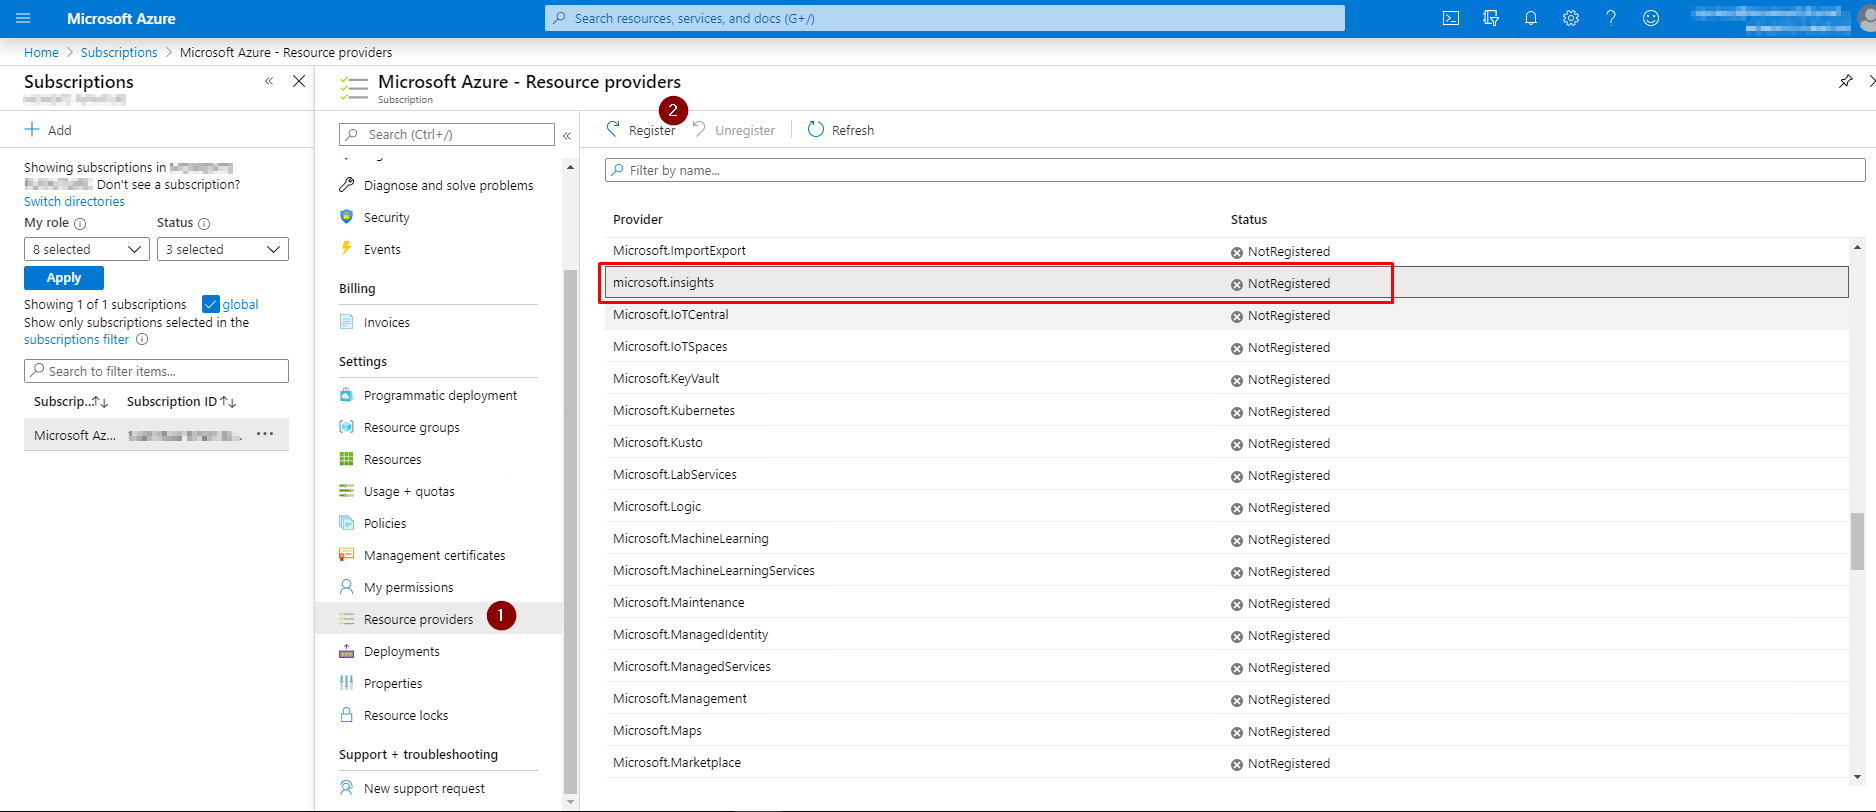
If you never used Log Analytics before, the first step will be to register the microsoft.insights Resource Provider. Go to your subscription and select Resource providers (1). Search for the microsoft.insights provider and click on Register (2).
When the resource provider is registered, you can create a new Log Analytics workspace. In the Azure portal, search for Log Analytics workspace. When selected, click on + Add.
Note: if you have an existing existing workspace, you can link it here (1).
Fill in a name for the Log Analytics Workspace (1), choose your Subscription (2) and select the Resource group (3) you want to use. You can change to a Capacity Reservation tier after your workspace is created. Click OK (4) to create the workspace.
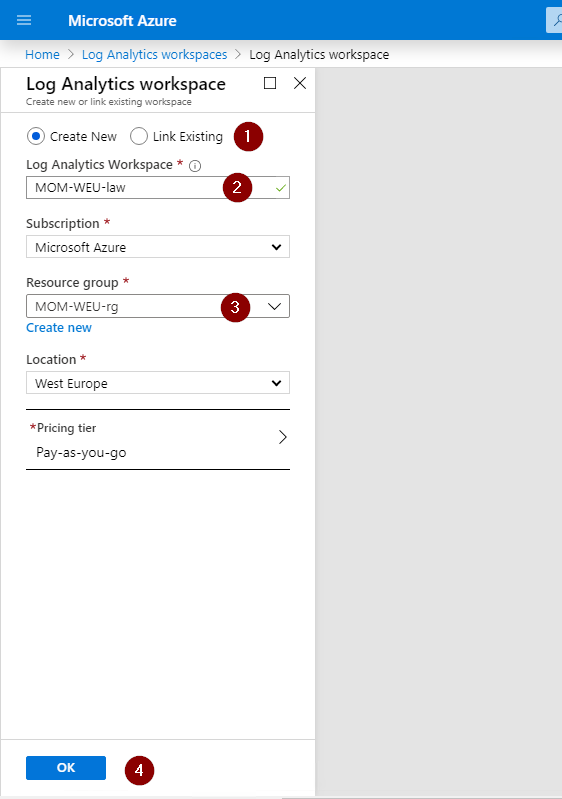
The Per GB 2018 pricing tier is a pay-as-you-go tier offering flexible consumption pricing in which you are charged per GB of data ingested. There are additional charges if you increase the data retention above the 31 day included retention. You can increase it by going to Usage and Estimated Cost section within your workspace. Click on Data Retention change the range.
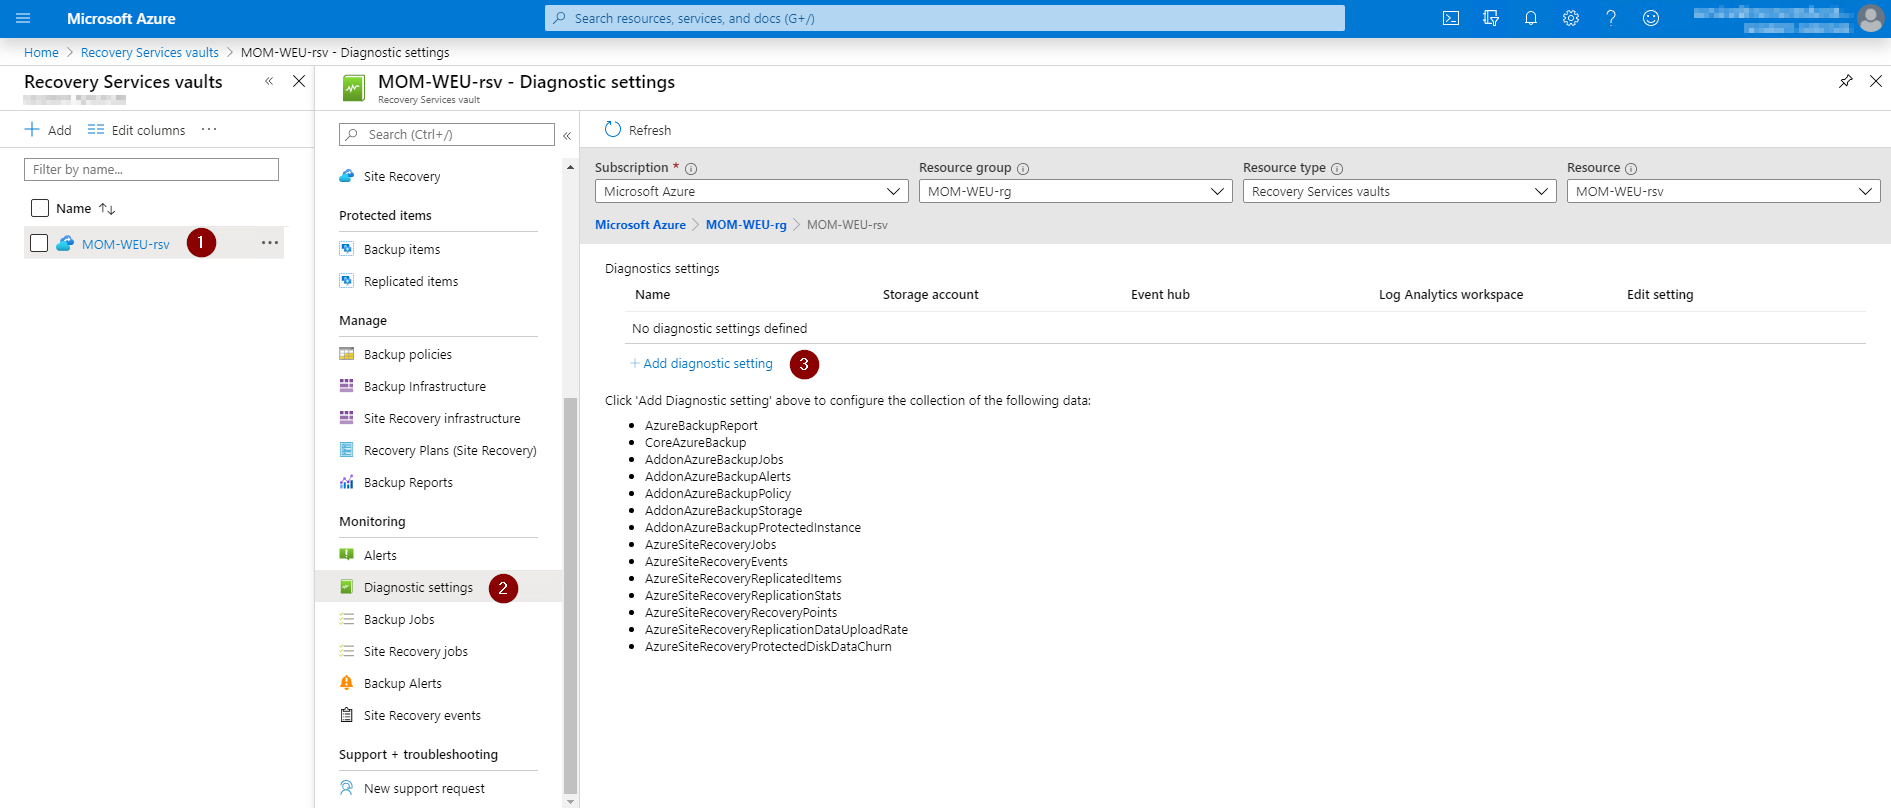
Once the workspace is created, navigate in the portal to your Recovery Services vault (1) and click on Diagnostic settings (2). Click on + Add Diagnostics setting (3).
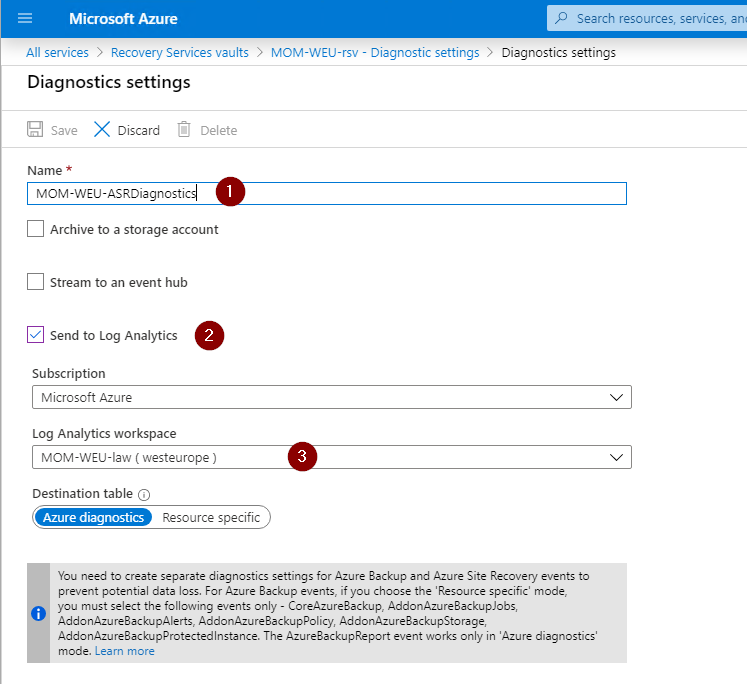
Fill in the Name (1) and select Send to Log Analytics (2). Select the subscription and the Log Analytics workspace (3) you created earlier. Select Destination table. This is which table resource data is stored in.
Note: you need to create separate diagnostics settings for Azure Backup and Azure Site Recovery events to prevent potential data loss.
Select all the logs with the prefix AzureSiteRecovery, do not select the AzureBackup options.
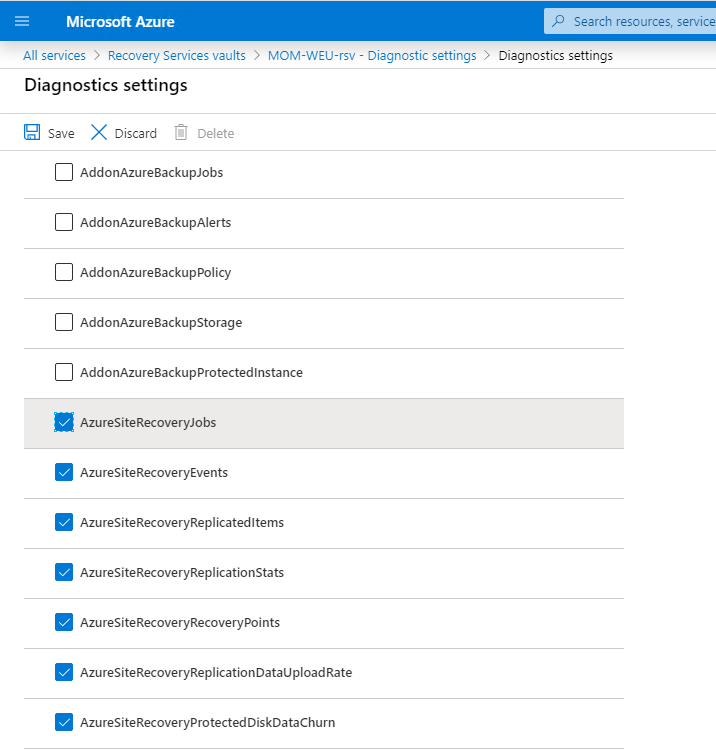
Now the Site Recovery logs start to feed into a table called: AzureDiagnostics in the selected workspace you created earlier.
It can take a while for data to start flowing in. Let the logs feed in about a day or 2, then you can collect some useful info.
Configure Microsoft monitoring agent
For detailed logs about: Source data upload rate and Data change rate (churn), a Microsoft monitoring agent is required to be installed on the Process Server.
Note: To get the churn data logs and upload rate logs for VMware and physical machines, you need to install a Microsoft monitoring agent on the Process Server. This agent sends the logs of the replicating machines to the workspace. This capability is available only for 9.30 mobility agent version onwards. When testing in my lab, it does not work for Hyper-V.
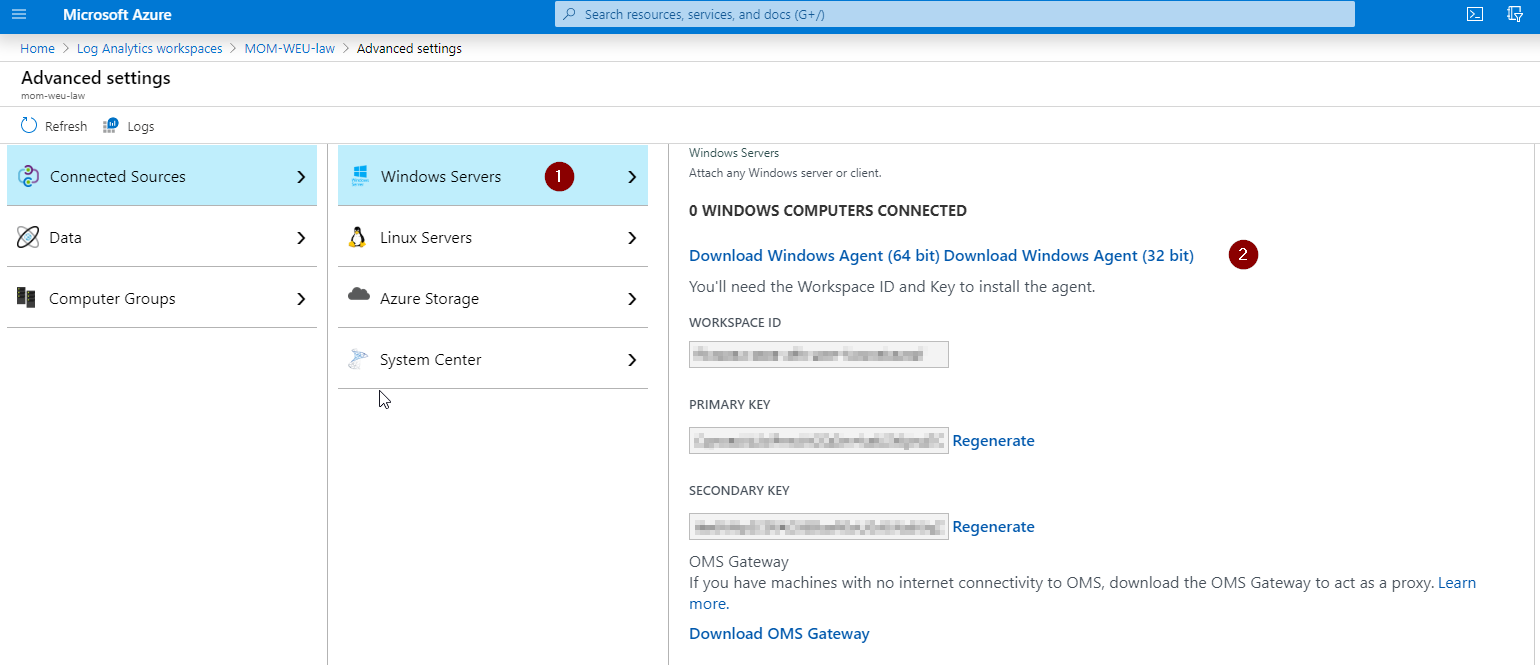
To Install the Log Analytics Agent, in the Azure portal go to your Log Analytics workspace, under Settings select Advanced settings.
Navigate to Connected sources and select Windows Servers (1). You will be provided with a link to download a windows agent for 32bit or 64bit. Select the Download Windows Agent (64 bit) (2).
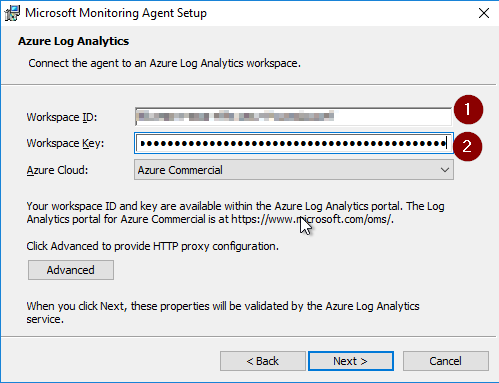
Copy the WORKSPACE ID and the PRIMARY KEY, you will need this information to provide during the agent installation process.
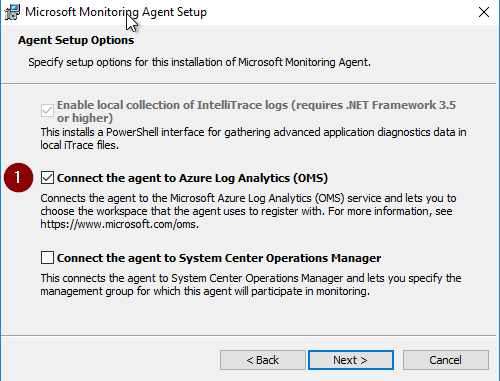
You have to install the agent on all your Processing Servers. Just follow the simple install procedure:
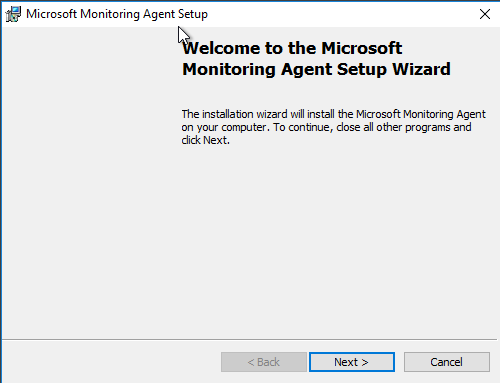
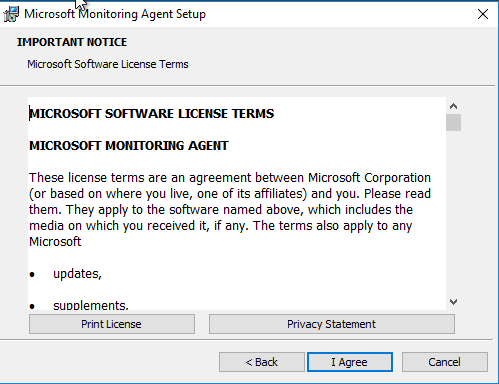
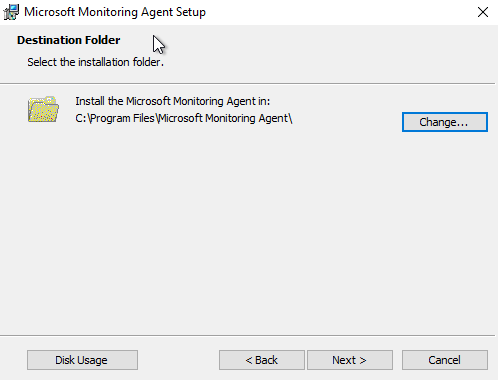
Select: Connect the agent to Azure Log Analytics (OMS) (1)
Provide Workspace ID (1) and Workspace Key (2), you can find in Advanced Settings.
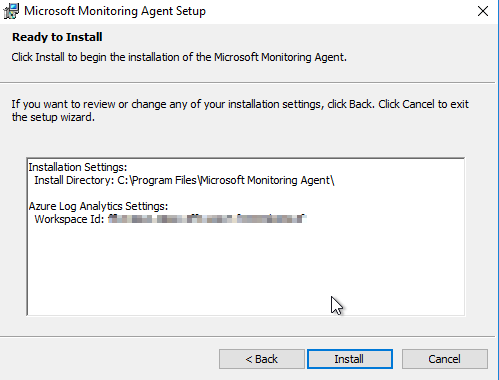
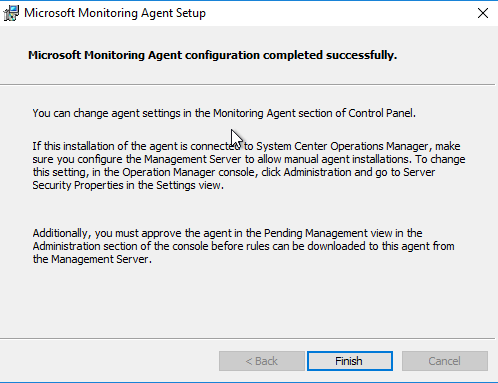
Finish installation
Check if MMA has been sucessfuly installed: Go to Control Panel and select Microsoft Monitoring Agent:
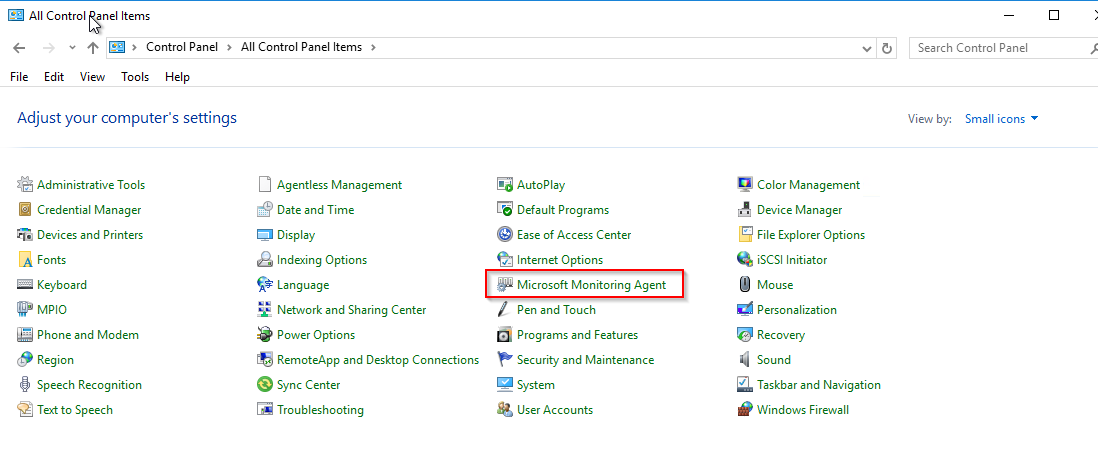
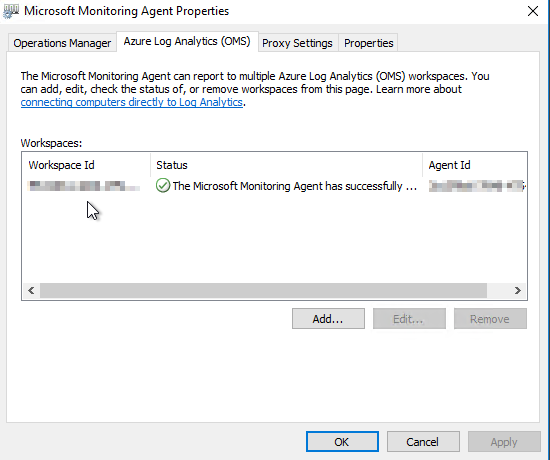
Once the installation is complete, go to your Log Analytics workspace and click on Advanced Settings. Go to the Data page and further click on Windows Performance Counters.
Click on ‘+’ to add the following two counters with sample interval of 300 seconds:
ASRAnalytics(*)\SourceVmChurnRate
ASRAnalytics(*)\SourceVmThrpRate
The churn and upload rate data will start feeding into the workspace!
Log query
To see if an agent is sending some logs, go into the workspace you created and click Logs.
Hint: Log queries are written with the Kusto query language
Start a simple log query to see if your agent is sending heartbeats. In the query field type:
Heartbeat
| where Category == "Direct Agent"
| where TimeGenerated > ago(30m)

If you receive logs from Direct Agent, you know you are receiving logs and you can start to query those Logs!
start to query!
Some of the examples use replicationProviderName_s set to A2A. This retrieves Azure VMs that are replicated to a secondary Azure region using Site Recovery. In these examples, you can replace A2A with InMageAzureV2, if you want to retrieve on-premises VMware VMs or physical servers that are replicated to Azure using Site Recovery.
For below examples I’m using the Log Analytics demo environment. Which is very useful for testing purpose since it has a lot of data to learn the KUSTO language. Get me to the demo workspace!
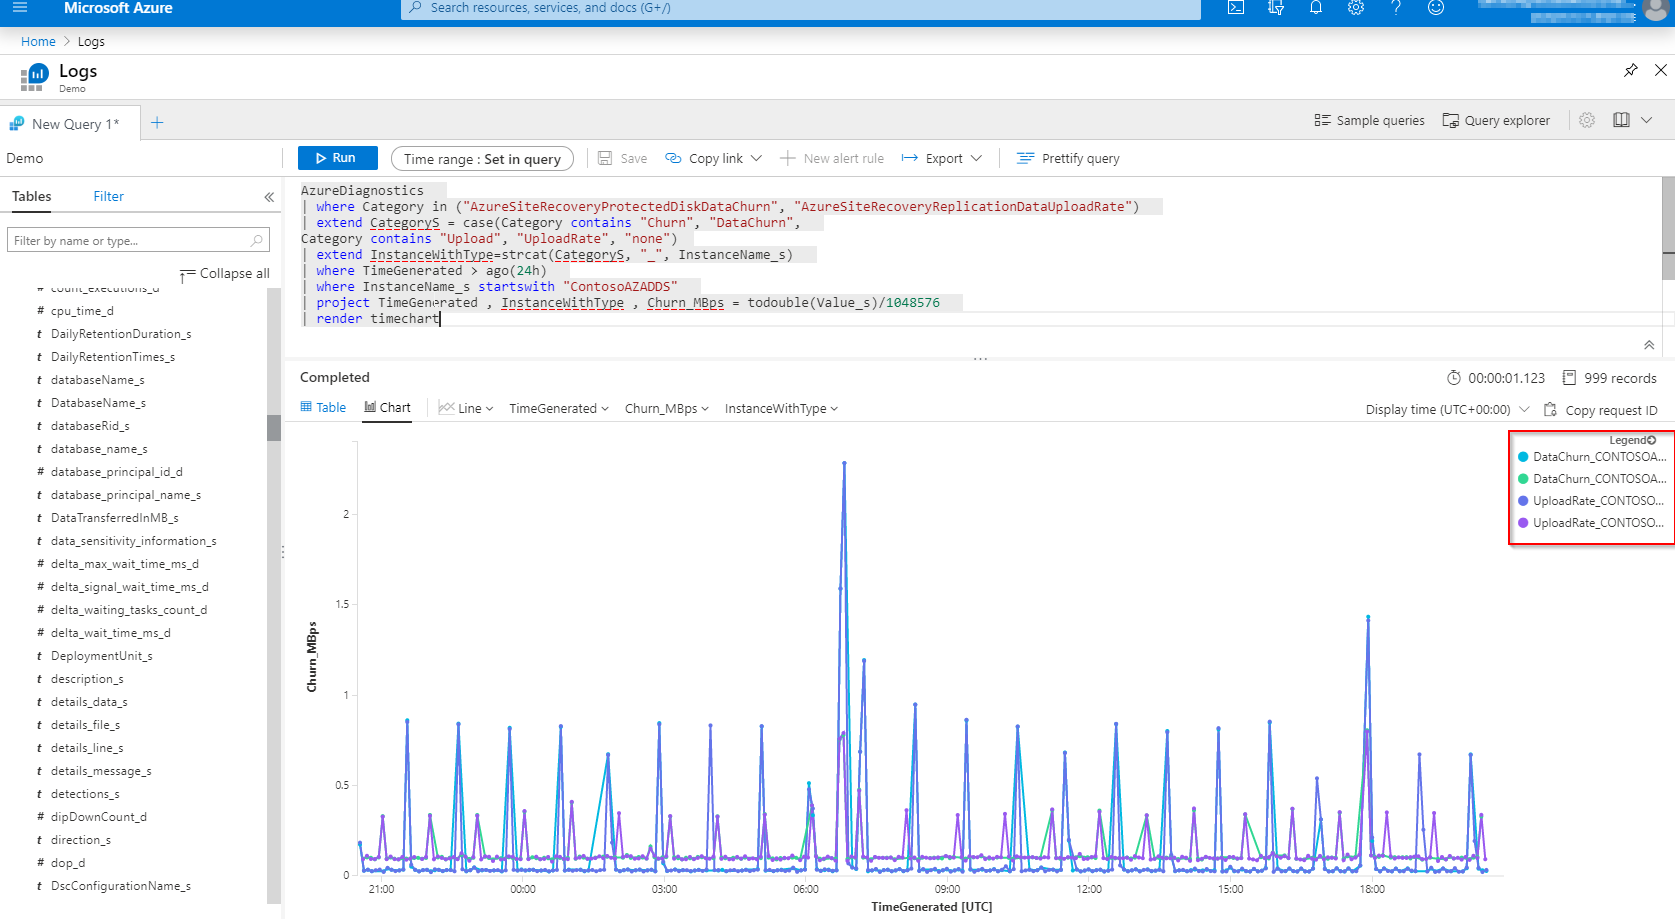
Query data change rate (churn) and upload rate for an Azure VM starting with name: ‘ContosoAZADDS’.
AzureDiagnostics
| where Category in ("AzureSiteRecoveryProtectedDiskDataChurn", "AzureSiteRecoveryReplicationDataUploadRate")
| extend CategoryS = case(Category contains "Churn", "DataChurn",
Category contains "Upload", "UploadRate", "none")
| extend InstanceWithType=strcat(CategoryS, "_", InstanceName_s)
| where TimeGenerated > ago(24h)
| where InstanceName_s startswith "ContosoAZADDS"
| project TimeGenerated , InstanceWithType , Churn_MBps = todouble(Value_s)/1048576
| render timechart
We can now see this useful information about the churn rate in MBps:
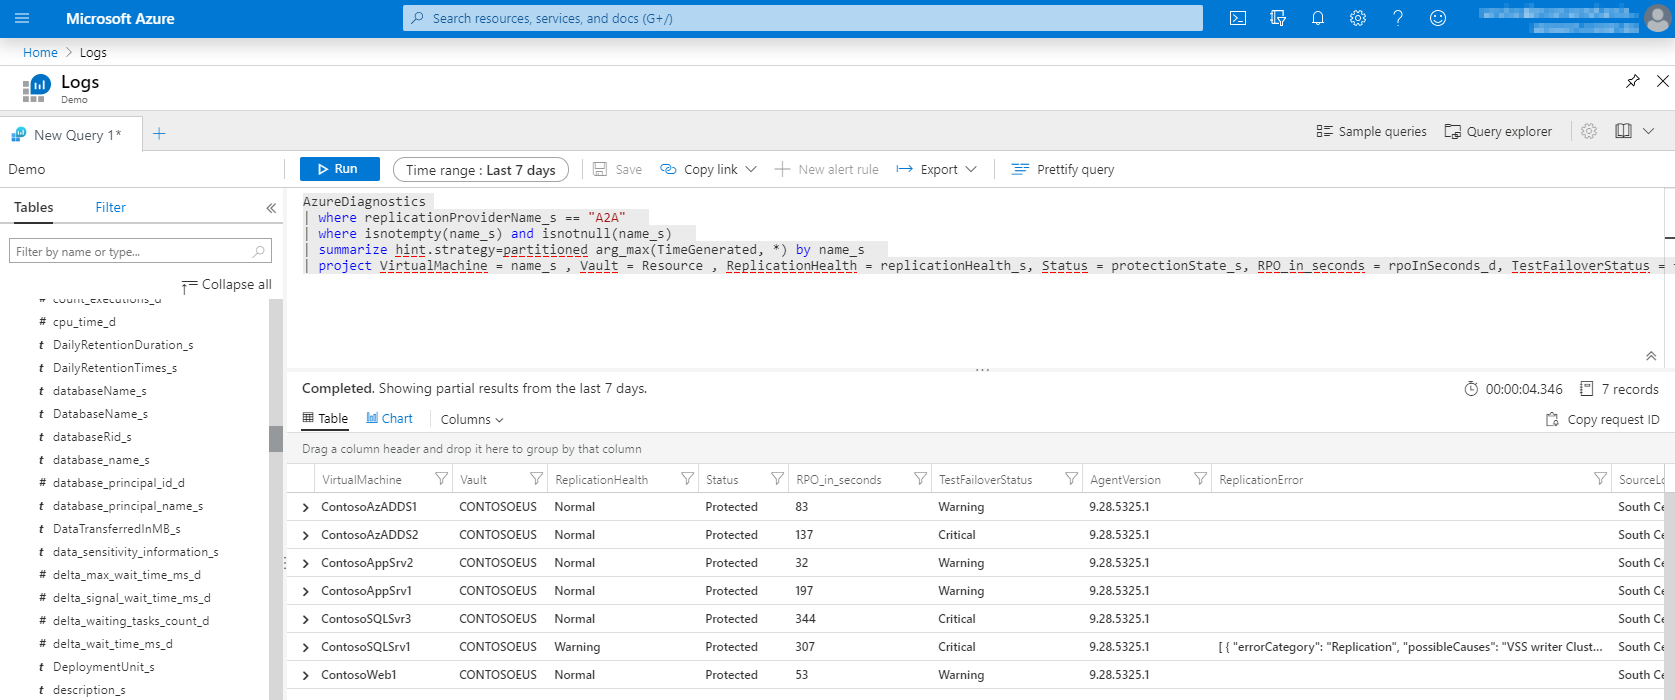
To query a summary for Azure VMs replicated to a secondary Azure region. You can use this query:
AzureDiagnostics
| where replicationProviderName_s == "A2A"
| where isnotempty(name_s) and isnotnull(name_s)
| summarize hint.strategy=partitioned arg_max(TimeGenerated, *) by name_s
| project VirtualMachine = name_s , Vault = Resource , ReplicationHealth = replicationHealth_s, Status = protectionState_s, RPO_in_seconds = rpoInSeconds_d, TestFailoverStatus = failoverHealth_s, AgentVersion = agentVersion_s, ReplicationError = replicationHealthErrors_s, SourceLocation = primaryFabricName_s
It shows VM name, replication and protection status, RPO, test failover status, Mobility agent version, any active replication errors, and the source location.
You can find more information on the Microsoft docs page: Monitor Site Recovery with Azure Monitor Logs.
Using log information to trigger Alerts
If we want to automatically generate alerts, based on the logs we are receiving. Then we have to first filter out the status of the replication process and see if any critical alerts are triggered.
Let’s create a query to show alerts with critical status, so we can use this information in our Alert Rule:
AzureDiagnostics
| where replicationProviderName_s == "A2A"
| where replicationHealth_s == "Critical"
| where isnotempty(name_s) and isnotnull(name_s)
| summarize hint.strategy=partitioned arg_max(TimeGenerated, *) by name_s
| summarize count()
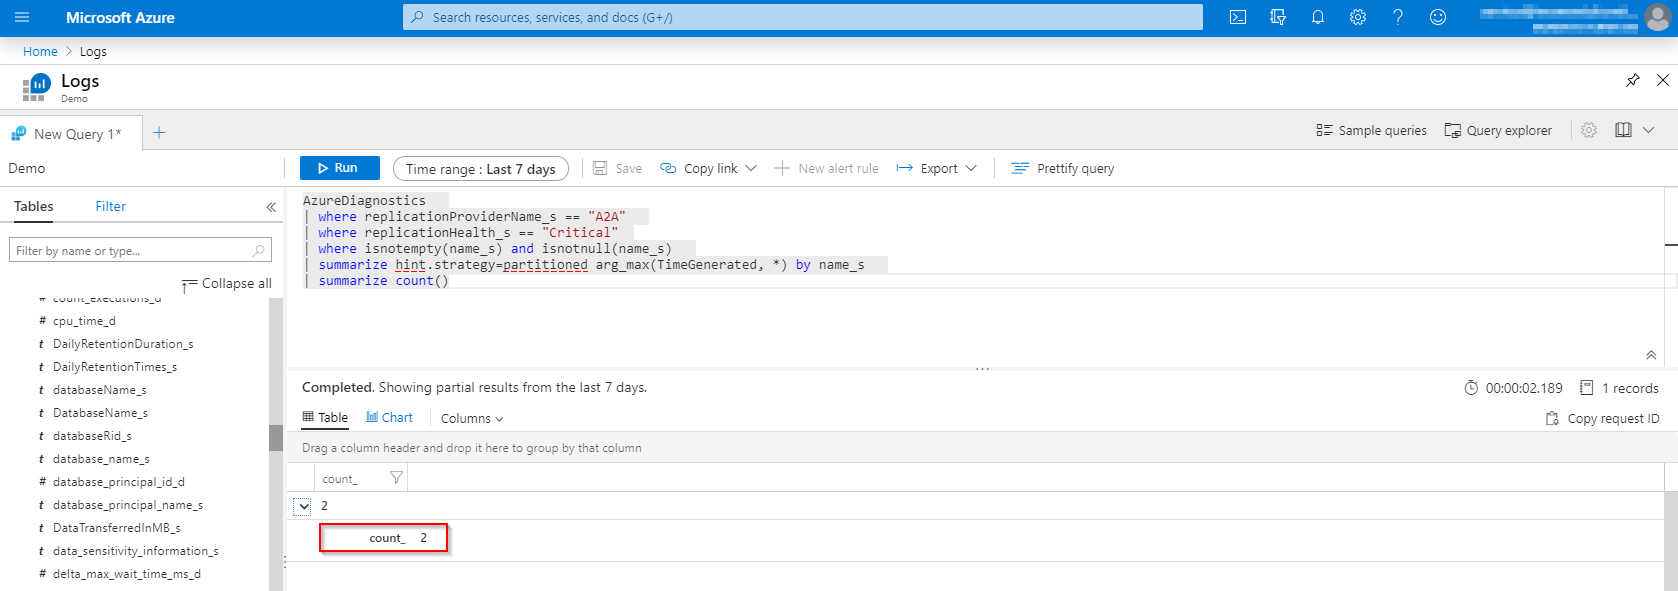
Copy the query, we will need this later on.
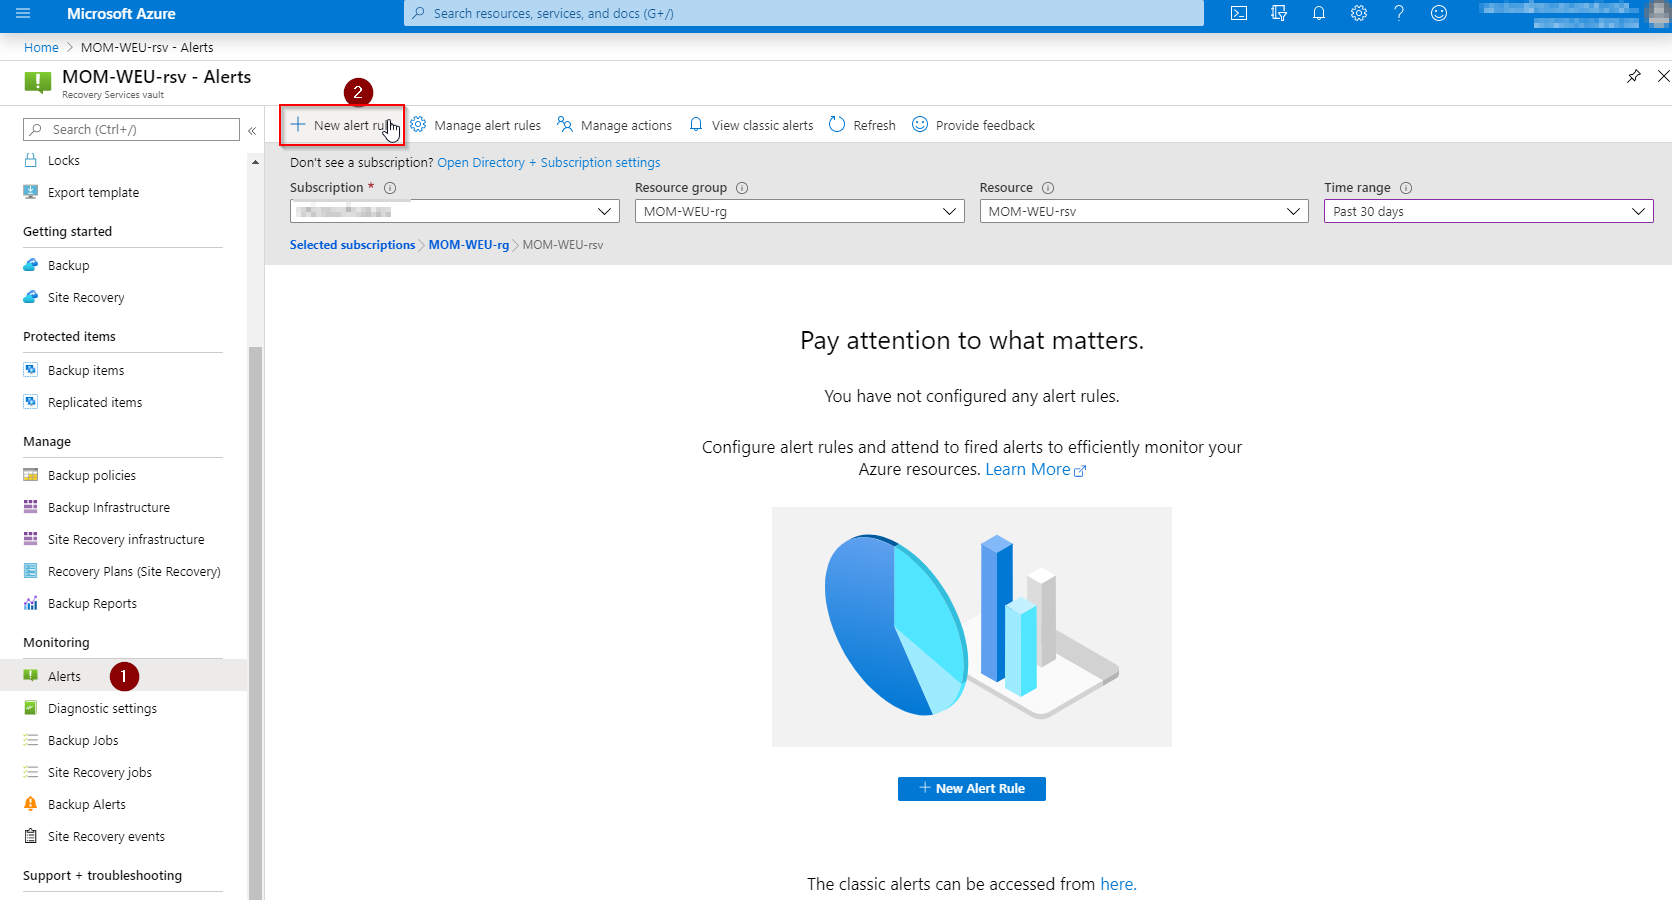
In the Azure Portal, go to your Recovery Services vault and select Alerts (1), then click on New alert rule (2).
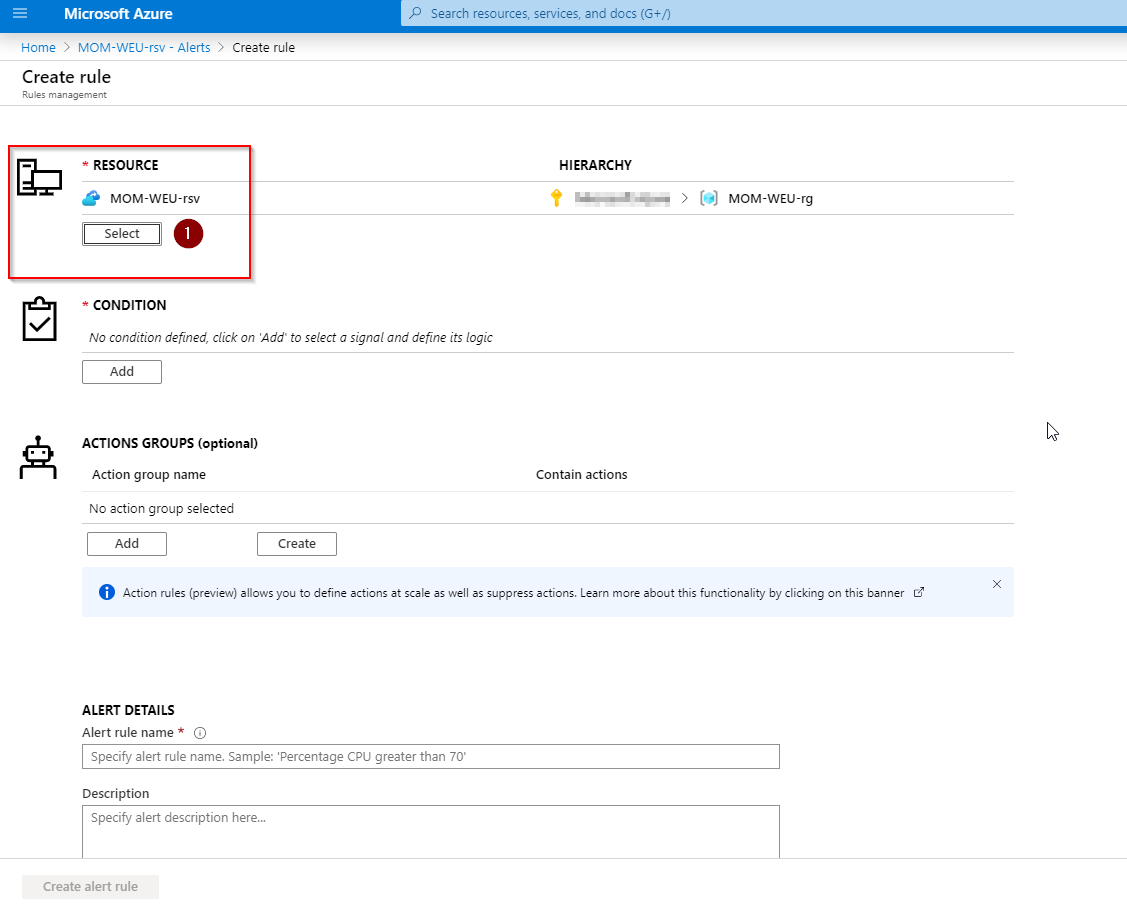
In the Resource option, click on Select, to select our Log Analytics workspace, instead of our Recovery Services vault.
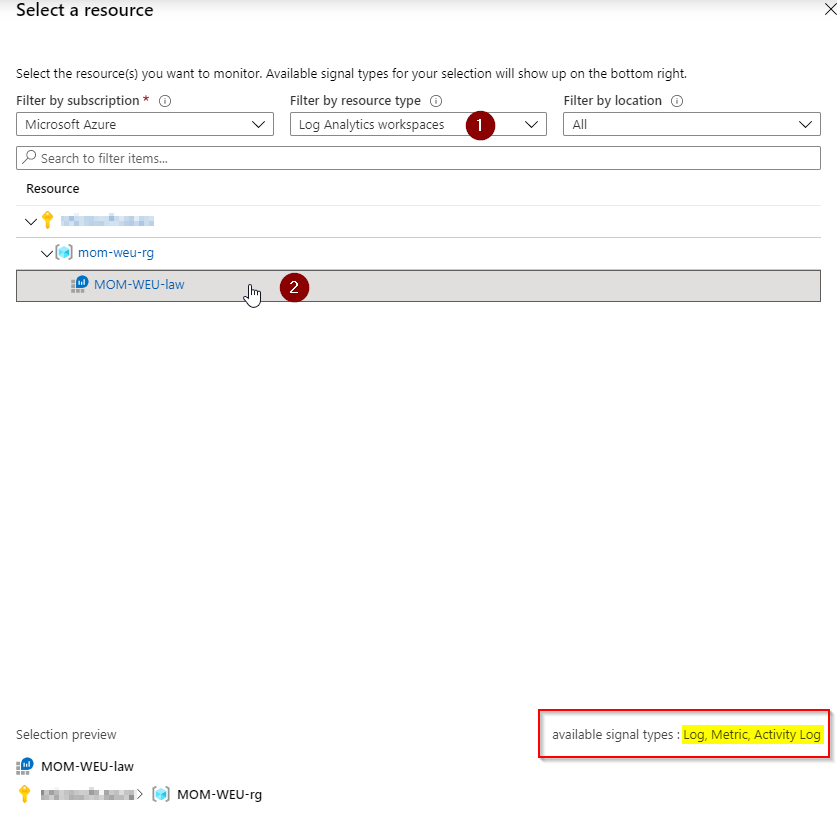
In the Filter by resource type (1) search and select Log Analytics workspace (2).
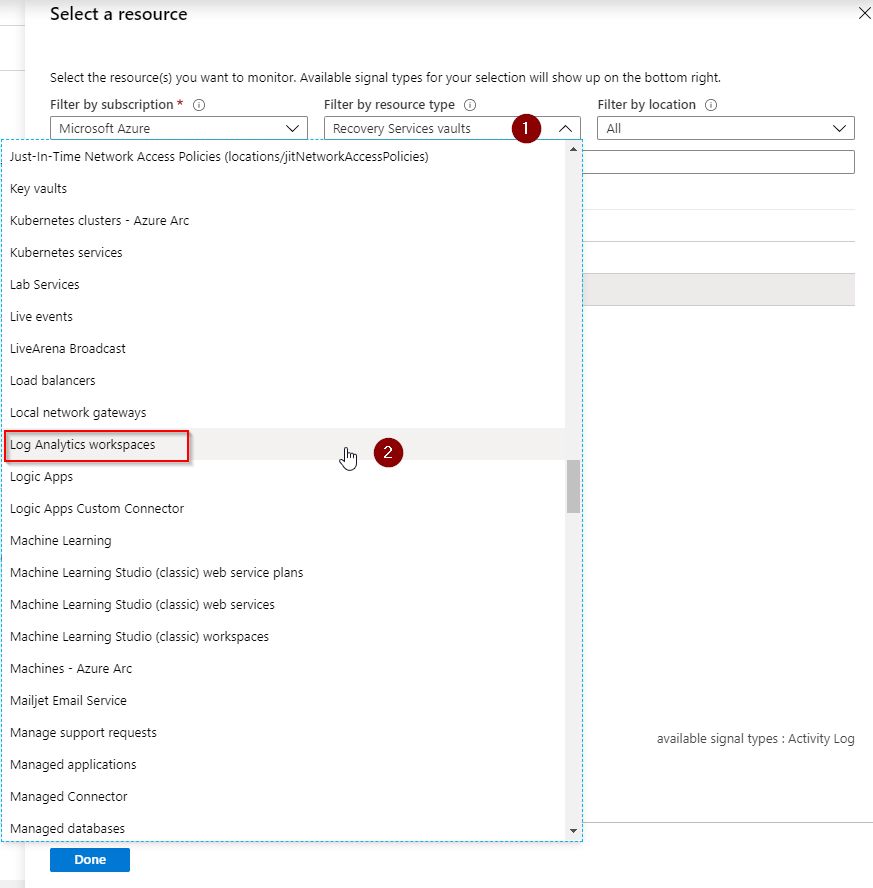
Be sure to check if Log Analytics workspaces (1) is selected and click on your Log Analytics workspace name (2). You can see the available signal types have changed to: Log, Metric and Activity Log. We need the Log and Metric data, this is why we use our Log Analytics workspace to create an alert for.
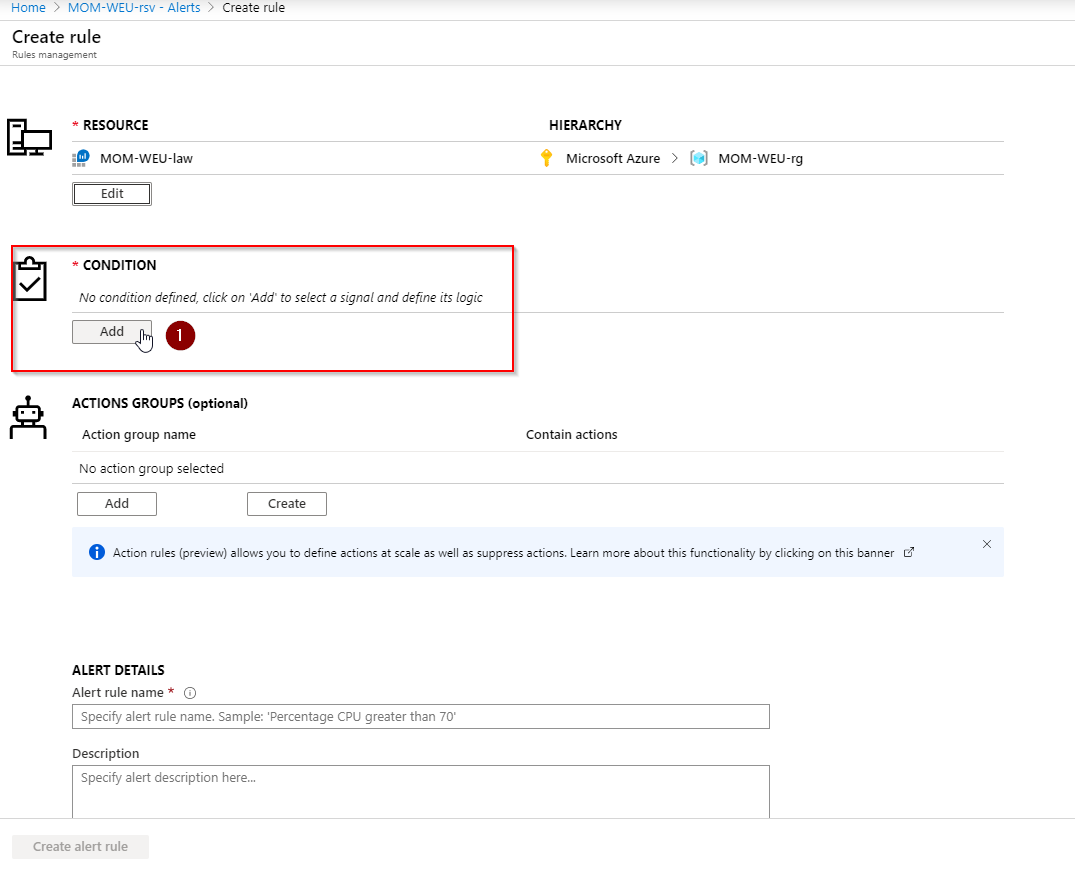
Add a Condition:
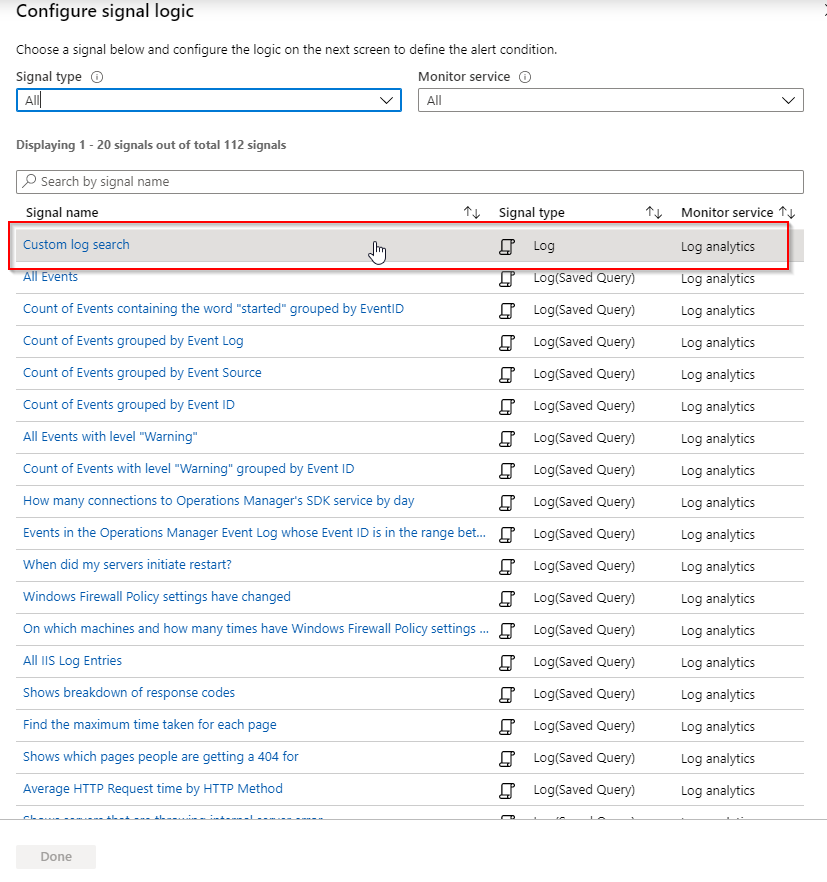
Configure signal logic and select Custom log search:
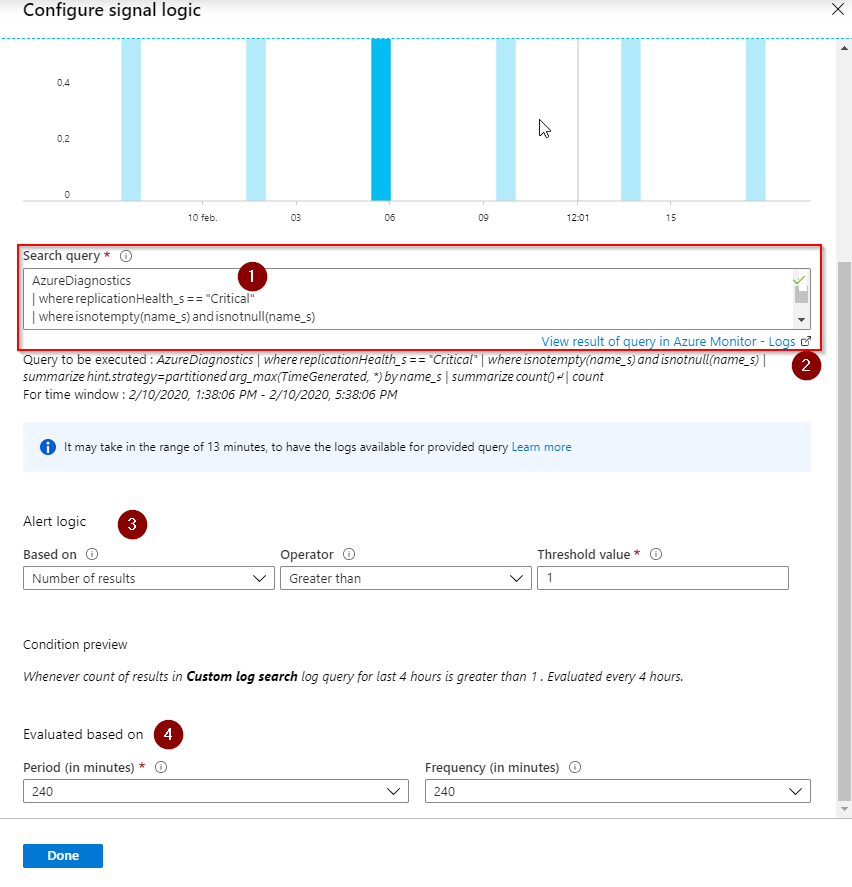
Now we have to paste in the custom Search Query (1) we have created in previous steps. You can test the query again if you want by clicking on view result (2). Change the default Alert logic (3) and the Evaluated based on (4) parameters. Click on ‘Done’ when all settings are good.
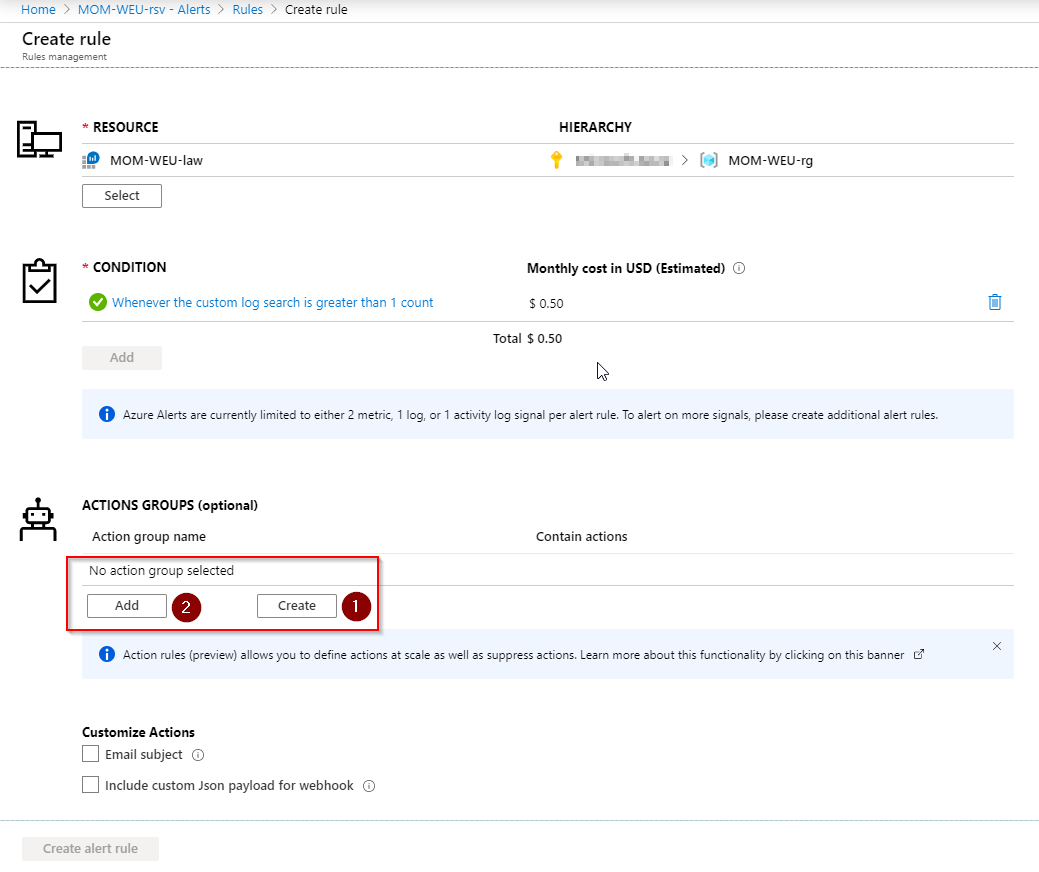
By using an Action Group, we can create Email or other notifications. Click on Create (1) if you don’t have an action group defined, otherwise click on Add (2) and choose the existing Action group.
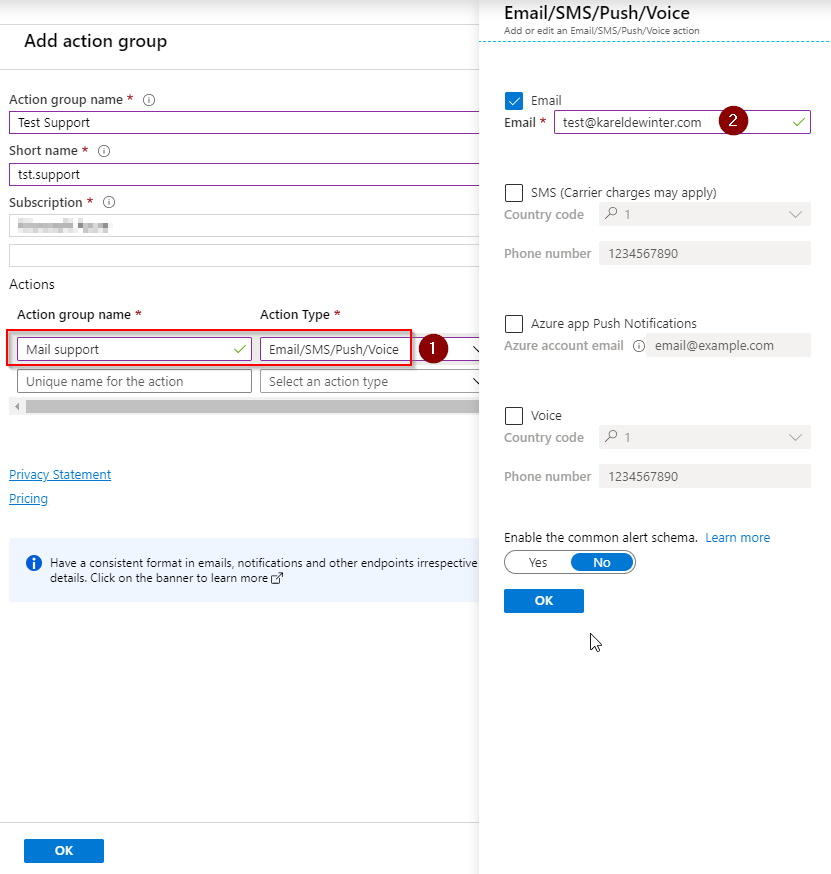
Fill in the Action group name and Short name and select the subscription. Give the Action group (1) a name and choose an action type for your needs. I will choose Email,SMS,Push,Voice. Select Email (2) and fill in a working Email address. Click on OK and confirm the page again with OK on the bottom.
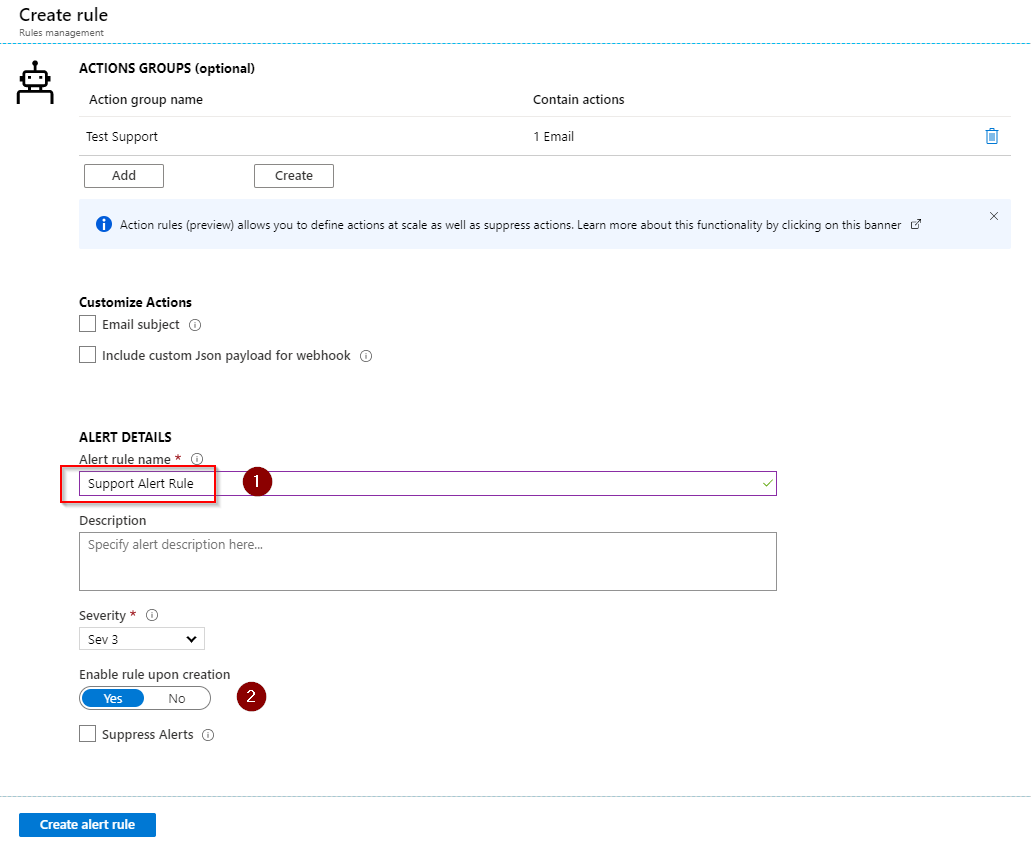
To complete the creation of the Alert Rule, we have to fill in an Alert rule name (1) and give it a description, click on Enable rule upon creation (2) and finally Create alert rule.
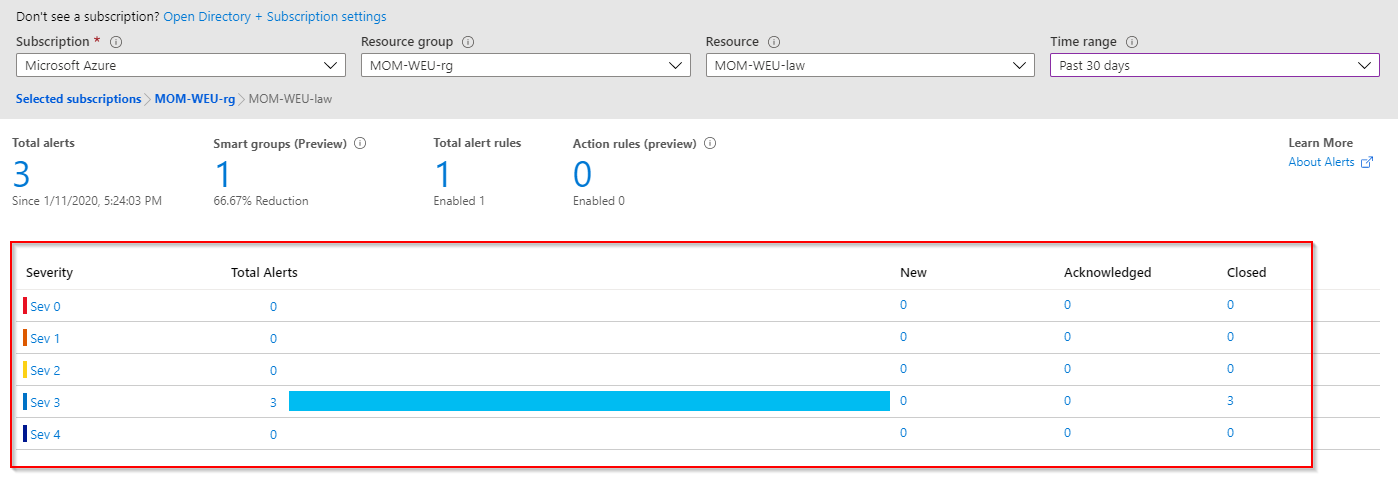
We can monitor our Total Alerts on the Alerts dashboard. We also see our New, Acknowledged or Closed Alerts.
Configure Backup Alerts
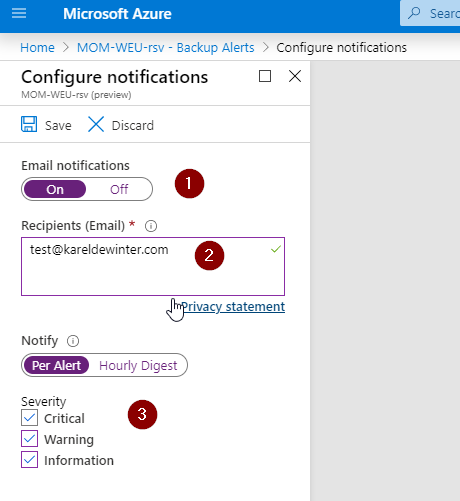
You can also configure alerts, if you have Azure Backup configured. Go to your Recovery Services vault and select on Backup Alerts, click on Configure notifications and Enable (1) Email notifications. Fill in the recipients (2) that will receive the notifications and apply which Severity will be alerted:
I hope you have learned something new, and if you have any questions, do not hesitate to contact me. I will be glad to help you out!
Keep your Azure environment clean!
Be sure to follow along with the upcomming articles from Azure Spring Clean!

